| Chapter Four
PLANNING AND OPERATIONS 4.0 INTRODUCTION Electric utility planning and operations cover a wide range of utility functions from the forecast of demand and energy requirements to the delivery of service to the customer. The effectiveness of this process depends on a range of factors from service territory characteristics to power supply alternatives to development and management of facilities. How well these tasks are accomplished is reflected in electric rates, reliability, quality of service, environmental impacts and work force issues. The following chapter summarizes key issues and comparative measures related to planning and operations for the Nebraska systems. It is divided into seven sections: Electric Facilities; Reliability; Integrated Resource Planning; Environmental Issues; Technology Development; Workforce; and System Efficiency. While each of the sections contains descriptive information and key comparative data, the last section provides a series of comparative measures on the efficiency and effectiveness of the Nebraska systems in both regional and national contexts. 4.1 ELECTRIC FACILITIES Nebraska’s electric facilities are individually-owned or jointly-owned by groups of the 171 wholesale and retail entities operating within the state. As will be discussed in Chapter 5, the electric utility industry is one of the most capital intensive operations in the United States. Electric systems in Nebraska in 1995 had a gross investment of more than $5.6 billion. This breaks down into $2.8 billion for generation facilities, $800 million in transmission facilities, $1.5 billion in distribution facilities and $454 million in general plant. Other non-classified categories of investment and construction-work-in-progress brings the total to nearly $6.2 billion.1 As the largest systems in the state, NPPD, OPPD and LES own many of the major generating plants. NPPD also owns the bulk of the state’s transmission lines. The distribution systems are owned by the municipal systems, public power districts, municipalities and rural cooperatives. Although the systems are diverse, joint planning for generation, transmission and distribution has been an area of increasing cooperation as reflected in the Integrated Resource Plan developed by the Nebraska Power Association. Each segment of the industry’s facilities is described below. 4.1.1 Generation In 1995 Nebraska systems owned a total of 5,512 megawatts of accredited or demonstrated generating capability. In addition to these facilities, the Nebraska systems purchased 1,031 megawatts of firm capacity and an additional 84 megawatts of non-firm capacity (without reserves). The 26 major generating resources are listed on the following table (Table 4-1).
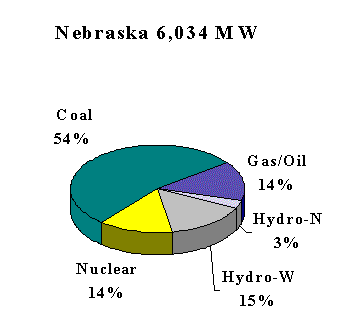
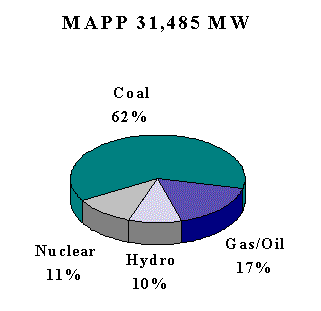
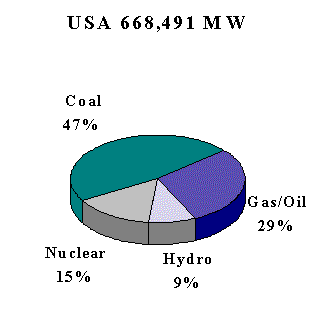
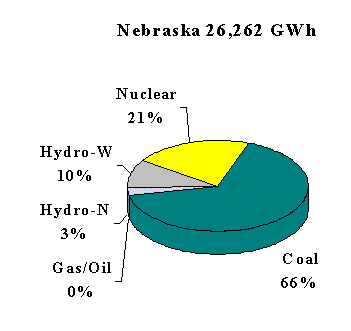
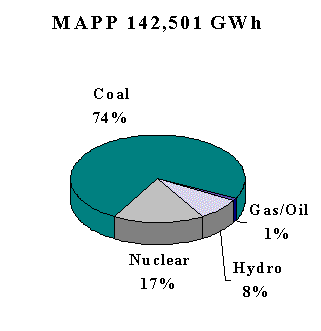
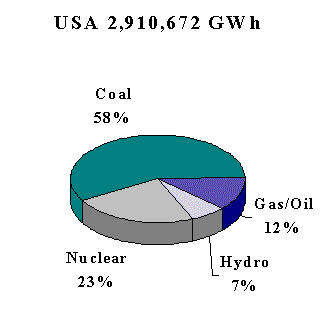
NOTE: The Nebraska resource list above includes the Western Area Power Administration hydro and the Laramie River Station purchases from out-of-state and excludes a one-half capacity output sale of Cooper to an out-of-state utility. The list does not include the firm sale from Basin to Tri-State for Western Nebraska Rural Electric Systems. In 1996, that amount was 186 MW. It also excludes the 1996 accredited capacity of Sarpy County Unit #3 Gas Turbine (105.40 MW) and Gentleman Full Capacity Utilization. It also does not include various shorter term sales of capacity that will end prior in the time that capacity is needed to serve Nebraska customers. There are three general categories of generating plants: baseload -- which are used on a nearly constant basis because of their low energy cost and operating efficiencies; intermediate -- which usually have moderate energy cost and operating efficiencies combined with the capability to go on and off line relatively quickly; and peaking plants -- which have the most rapid start-up and shut-down capability and are the highest energy cost plants. The costs of plant operation are tied not only to the design and capability of the plant, but also to fuel type. 4.1.1.1 Fuels and Fuel Mix Coal is the dominant fuel source in Nebraska, MAPP and the nation, whether measured on a capacity or energy basis. Because coal and nuclear fuels have low energy costs they are used as baseload units and their energy shares are greater than their capacity shares (due to being run more frequently). Conversely, gas/oil fuels have higher energy costs and are usually used for either intermediate or peak load and emergency situations such that gas/oil energy shares are lower than their respective capacity shares. Hydro plants are geography-specific and typically have similar capacity and energy shares, except for the hydro purchase from Western Area Power Administration, which has a peaking portion to it. Nebraska’s purchase of hydropower from WAPA (W) and Nebraska’s in state hydro plants (N) are shown separately in the following charts.
Chart C4-1 -- 1995 Power Plant Fuel Diversity on Demonstrated MW Capacity Basis
Generally, Nebraska’s fuel mix is representative of that in MAPP and the nation. One very noticeable difference is the small amount of natural gas/oil fired generation (zero to 1 percent) whereas the nation as a whole produces 12 percent of its power supply from these fuels. Small oil-and-gas fired diesel power plants in Nebraska have operating capability, but are not run very often It is important to have power generation sources that utilize a mix of fuel types to minimize risk of price fluctuations and availability. Chart C4-1 indicates Nebraska’s diversity by demonstrated megawatts (MW) of capacity. Chart C4-2 shows fuel diversity in terms of energy-actual hours of operation measured in gigawatt hours (GWh).
Chart C4-2 -- 1995 Power Plant Fuel Diversity on Net Energy GWh Basis
4.1.1.2 Plant Factor The relative status of Nebraska power plants can be measured by comparing Nebraska’s generation resources to resources in the MAPP region and to the nation’s resources. The measure of Plant Factor as shown in Table 4-2 yields a comparison of how much a plant operates compared to maximum output operation and is generally a function of its efficiency compared to other types of plants.
*For Nebraska, Hydro values are separated into Western Area Power Administration (W) and Nebraska generation (N). 4.1.1.3 Power Plant Production Cost Power Plant Production Cost includes two components: (1) Fuel cost and (2) the Operating (less fuel) and Maintenance expenses. Fuel costs generally make up two-thirds of production costs. Table 4-3 shows that Nebraska plants generally compare favorably with plants in both the MAPP region and the nation as a whole. Proximity to coal fields contributes to the state’s lower production costs. Nebraska’s higher nuclear plant costs are due in part to the design of a single unit rather than multiple unit plant.
*For Nebraska, Hydro values are separated into Western Area Power Administration (W) and Nebraska generation (N). 4.1.1.4 Purchased Power Costs and Wholesale Rates Purchased power costs and wholesale rates reflect the cost of power for Nebraska distribution systems acquired from generating agencies located primarily in Nebraska. Western Area Power Administration (WAPA) is also a partial requirements wholesaler to a number of Nebraska utilities whose 1995 firm and non-firm average cost to Nebraska was 1.90 cents/kWh.) At the wholesale level, two 1995 surveys indicated that Nebraska wholesale firm rates compared favorably with regional and national data. The first (shown in Table 4-4) was a National Rural Utilities Cooperative Finance Corporation (CFC) survey involving only rural systems purchasing at wholesale which revealed Nebraska 14 percent below regional wholesale rates and 19 percent below national. The second (shown in Table 4-5) was an Edison Electric Institute (EEI) comparison for investor owned utilities for resale. The Nebraska average was 21 percent below the January national cost and 11 percent below the July national cost.
Source: National Rural Utilities Cooperative Finance Corporation
Source: Edison Electric Institute 4.1.2 Transmission and Subtransmission The existing high voltage (345kV, 230kV, 161kV and 115kV) transmission network in Nebraska consists of more than 6,200 miles of transmission lines with an investment cost of about $597,050,000. These transmission facilities are interconnected with regional facilities in surrounding states for purposes of reliability and transfer of power and energy. The Nebraska high voltage transmission network is split into two distinct regions: the eastern region and the western region. Presently, the split between these two regions involves the transmission systems on either side of the Grand Island/Hastings area. The eastern Nebraska region is inherently secure and stable because typically 80 percent of the entire state’s load resides in the eastern region. (Stability increases when load or demand and generation are well-matched.) The western Nebraska region is on the western edge of the Eastern Interconnected System of the United States and exhibits completely different operational characteristics. Sparse population results in low demand and a large generation/load mismatch in this area. There is also a heavy reliance on the bulk transmission system for delivery of generation from this area to the state’s load centers in eastern Nebraska.2 Nebraska is interconnected with three of the nine North American Electric Reliability Council regions. Interconnections exist with MAPP thorough Iowa and South Dakota and allow transactions with the 70 MAPP members; Western Nebraska interconnections link the state through Wyoming to the Western Systems Coordinating Council grid; and interconnections through Kansas and Missouri link the Nebraska systems to the Southwest Power Pool. Geographical relationships between load and generation and the transactions of regional energy markets will impact future transmission limitations or "bottlenecks" in Nebraska. Six critical transmission interfaces have been identified in Nebraska representing constrained paths: Gerald Gentleman Station (GGS) Eastflow Stability Interface; W. Nebraska -- W. Kansas Transmission Interface; Grand Island -- Lincoln Area Transmission Interface; Cooper Southflow Transmission Interface; Fort Calhoun -- West Omaha Transmission Interface; Sub 3459 -- Sub 3456 Transmission Interface (Omaha area). The regional utilities have developed operating procedures and curtailment procedures to address high utilization of these constrained paths. Increases in firm transmission capacity usage on these interfaces may require the addition of new high voltage facilities.3 Future power flows through these paths must be monitored closely. The existing (34.5kV and 69kV) subtransmission facilities of the State of Nebraska consist of more than 6,600 miles of lines with an investment cost of about $201,475,000. The subtransmission system is normally a direct step down from the 161kV and 115kV high voltage transmission systems. Since the 1960s, state law has required open access to transmission above 34.5kV to support competition at the wholesale level.4 The construction of the subtransmission system is expected to continue as new and existing customers increase load demands and facilities are rebuilt to maintain or enhance reliability. An increase in competitive power purchases could also increase the need to undertake additional transmission and subtransmission construction. 4.1.3 Distribution Distribution facilities are that part of the electrical system that delivers power and energy directly to the ultimate customer. They include: distribution substations, distribution lines, associated equipment, points of transformation to utilization voltages and meters. Distribution substations step down the voltage from transmission or subtransmission levels to voltage levels suitable for distribution. The distribution lines that carry energy from the distribution substations to local load areas are called "main" or "primary" feeders and generally operate in Nebraska between 2.4 kilovolt and 25.0 kilovolt levels, depending upon design requirements. Numerous taps or lateral Lines are attached to main feeder lines as required to distribute electricity throughout the service area. "Tie lines" are often constructed between feeder lines to provide backup energy sources for load areas in the event of damage to a feeder fine due to severe weather or other incidents. Voltage is usually stepped down one more time from the distribution level to the utilization level by line transformers installed near customer load points. Utilization voltages vary considerably in level and configuration. Common household service is provided at 120/240 volts, single phase. Many small commercial consumers and some farms take service at 120/208, 120/240 or 277/480 volts, three phase. Larger commercial or industrial customers sometimes take delivery at 2,400 to 15,000 volts, three phase. Nebraska utilities have reported more than 85,000 pole/circuit miles of primary distribution lines in operation in 1995 and more than $1.5 billion in investment. As might be expected, more than 75 percent of the distribution line miles in operation are in rural areas of Nebraska.5 4.2 RELIABILITY Because electricity is so integral to customers’ residences, businesses and factories, it is imperative that electric service be reliable. Reliability is necessary at all levels in the production and delivery of electric energy. Power flows are very dynamic from hour to hour depending on factors such as: what generating plants are running at what output level, what transmission fines are in or out of service, what load levels are in the different geographic areas and what level of firm or non-firm sales are being conducted by others on the grid. 4.2.1 Generation Adequacy At the generation level, a key reliability measurement is the adequacy of generation. The percentage of generation reserves is a key factor. The Mid-Continent Area Power Pool (MAPP) requires utility members to meet planning reserve requirements of at least 15 percent of firm load obligations. The percent reserve margins, calculated using the North American Electric Reliability Council (NERC) methodology (percent of generation) for the United States, MAPP and Nebraska for 1996 and forecast for 2005 is as follows:
Data Sources: North American Electric Reliability
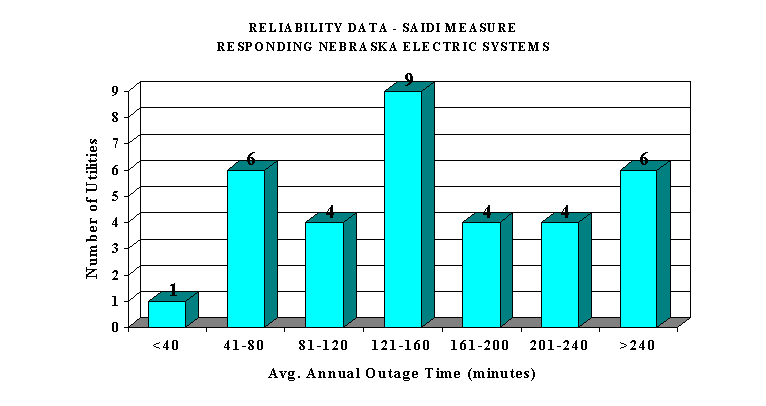
Council Assessment 1996-2005, October 1996; According to current forecasts, MAPP will have insufficient reserve margins in 2005 unless additional units are added. The extent of reserves in Nebraska depends upon the status of NPPD’s Cooper Nuclear Station. By 2004, the MidAmerican (Iowa) and LES purchase contracts expire with renewal options. Whether Cooper continues to operate to 2014 when the operating license expires will be a key factor in a statewide generation reserves adequacy. Depending upon the Cooper scenario, a statewide deficit could occur as early as 2005 or as late as 2010. The statewide IRP Report (1997-2016) states that in 2005 the statewide generation surplus/deficit could range from 548 MW surplus to 226 MW deficit depending on the Cooper decision. For the three largest utilities, NPPD’s 2005 range could vary from 558 MW surplus to 216 MW deficit; LES’ 2005 range from 3 MW deficit to 100 MW deficit; OPPD is forecast to have a 46 MW surplus in 2005.6 However, each individual utility is responsible to meet its generation and reserve requirements. Planning and coordination of generation are likely to be drastically altered in a competitive environment and reserves and firmness of capacity could be determined by price rather than policy. 4.2.2 Transmission Adequacy and Security Reliability is also determined by the adequacy and security of the interconnected bulk transmission system. The North American Electric Reliability Council (NERC) was established in 1968 to coordinate and promote the reliability of the generation and transmission systems.7 MAPP, a NERC regional area operating in the Eastern Interconnection, is a consortium of regional utilities (including major Nebraska systems) and other parties. It serves four basic functions: 1) a regional reliability council, responsible for bulk system reliability; 2) a regional transmission group, responsible for facilitating access to the transmission system; 3) a wholesale power and energy market, and; 4) a generation reserve sharing pool.8 The 1996 implementation of Federal Energy Regulatory Commission (FERC) Orders 888 and 889 has created an "open access" transmission system and wholesale power market in MAPP and the nation. The existing regional transmission system was constructed to deliver electricity from the generation to the load center. Transmission interconnections facilitate reserve sharing, stability, frequency control and economic interchange. In a competitive environment with the requirement to transfer larger amounts of power and energy, reliability will be dependent on the ability of the transmission system to evolve and expand. Nebraska transmission systems do meet NERC/MAPP standards and are considered reliable, but the competitive issues will be an ongoing factor both in Nebraska and the region. 4.2.3 Distribution Adequacy and Security The distribution delivery level is where most outage events occur involving loss of customer load. A widely accepted measure for a reliability comparison is the System Average Interruption Duration Index (SAIDI). While consistently defined distribution reliability data is not readily available on both a national and state basis (many utilities do not calculate the measure), 34 Nebraska systems do report the data. The Nebraska SAIDI data was tabulated in two components; rural systems involving 31 rural utilities and three other utilities (OPPD, NPPD and LES). Nebraska utilities’ reliability measure compares favorably to the limited national data available. National data indicates that during the 1991-1994 period public power systems experienced an average of 77.5 minutes of outage per customer in SAIDI measurement.9 Investor-owned utilities reported 163.2 minutes for the same period and measured.10 National rural electric systems reported a median of 208.8 minutes in 1995.11 The 34 Nebraska systems reporting data indicated and average of 166 minutes of outage per customer (SAIDI) for rural electric systems during 1995 and 58.6 minutes for the three public power systems.12 (See Chart C4-3) Chart C4-3
(OPPD, NPPD, LES = 58.6; All Rurals = 166.5)
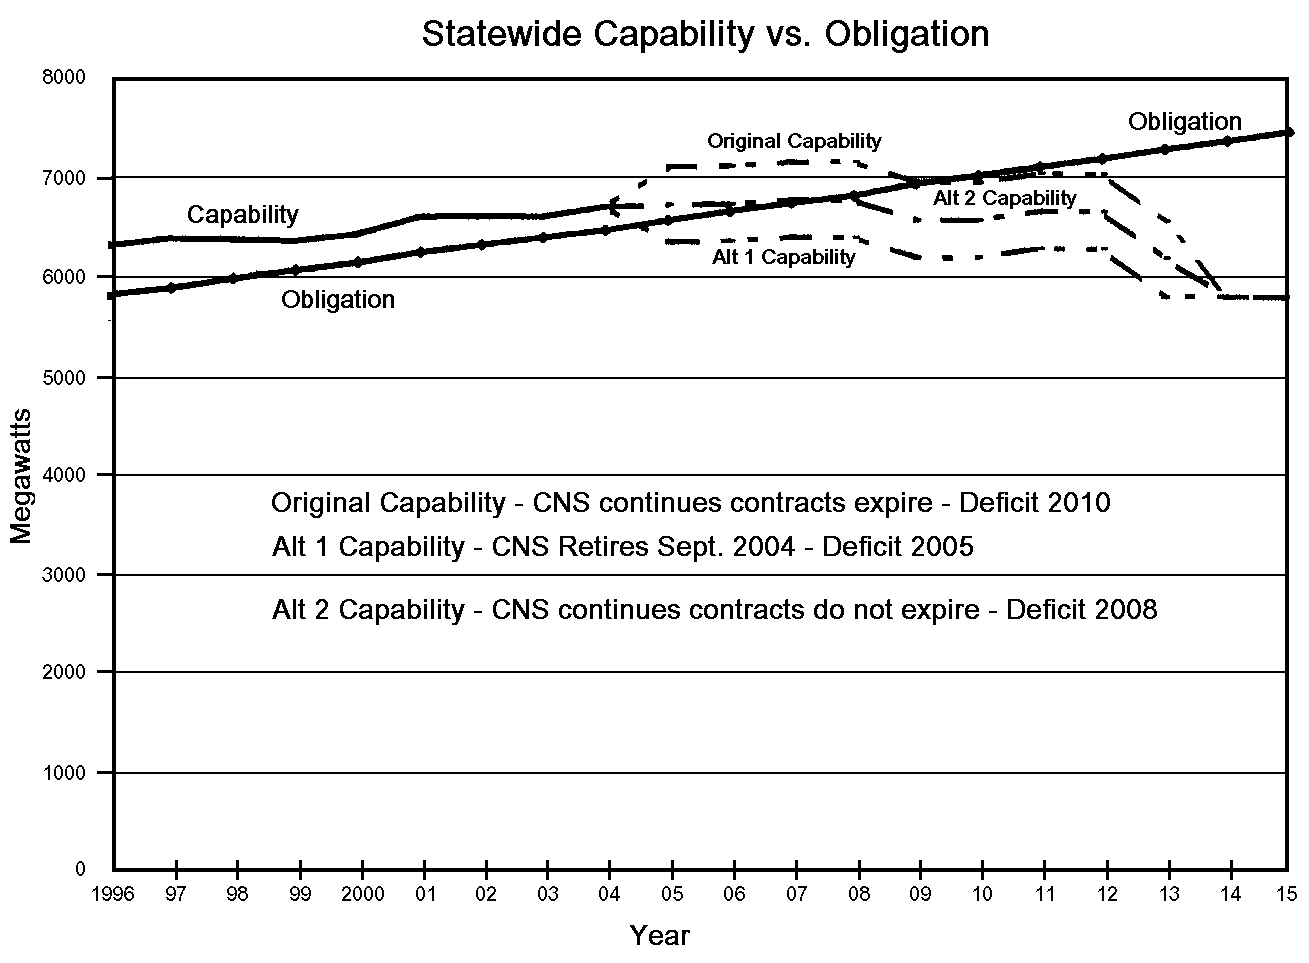
4.3 INTEGRATED RESOURCE PLANNING For Nebraska, Integrated Resource Planning fills an important role in developing a coordinated approach to future power needs.13 An Integrated Resource Plan (IRP) is a least-cost plan of demand-side and supply-side power resources that meets utility objectives and customer needs. IRPs are developed by individual utilities and a summary is developed and coordinated by the Nebraska Power Association. The principal objective of the coordination effort is for participating utilities to share information and ideas concerning future needs and capabilities of the Nebraska power industry and to determine how to best serve those needs. This cooperative effort helps avoid the duplication of facilities and economizes the cost of new projects where joint participation would result in better service to Nebraskans at lower cost. Areas specifically addressed include existing and projected load and generation capability, energy conservation and efficiency options, opportunities for joint projects, renewable energy generation update, transmission issues and outlook and environmental considerations.14 For the 20-year period 1997 through 2016, statewide peak demands are projected to increase at an average annual rate of 1.4 percent per year; rising from 5,204 MW to 6,642 MW. The individual utility projections range from 0.3 to 2.6 percent with urban areas typically growing at higher rates than rural. The statewide peak growth has been reduced from the 1986 NPA Report of 2.1 and 1.7 percent in the 1991 report. The system peak demand in any year is important because it governs how much resource capacity must be provided by the utility to satisfy its reliability obligations to the region and ultimately to the customers. This capability obligation to be planned and provided for is the system peak demand plus required reserves, which are essentially 15 percent additional to system peak demand. Energy requirements are also critical to integrated resource planning because they partially govern what type of resources will be most cost-effective. Resources include both demand-side and supply-side resources. However, existing demand-side resources and their ongoing effects are normally netted out of forecasted load as part of both the demand and energy forecasting processes. If the utility is deficit by not having provided enough resource capability to cover its peak obligation, then it must purchase capacity at a "penalty" price from the other utilities in the region according to established reliability agreements. The 1996 Statewide IRP Report describes likely future demand-and supply-side resource options. Typically, the lead time needed from initial planning to on-line operation ranges from five to eight years for a large coal-fired power plant; two to three years for a combustion turbine unit; three to five years for a gas combined cycle unit; and two to three years for a utility-sized wind facility. There are no nuclear plants now in the planning or construction stages and the lead time, even with streamlined siting and licensing, is expected to be much longer than for a coal plant. Purchase power options are traded on a daily basis for short term contracts, but can require a period ranging from a few months to two years for negotiation of long-term contracts. Such purchased generating capacity may not always be available or deliverable due to transmission constraints. As we approach an era of potential uncertainty concerning customer demand due to the mergence of retail competition, the flexibility and reduced risk of short lead time units such as wind and gas combined cycle can become an important consideration. However, power planners acknowledge when all factors are taken into consideration, low risk options, even those with lower initial capital cost, may not offer the best long-term economic advantage. On the demand side, expansions of the current load management, interruptible and other rate options useful for conservation purposes and efficient use of facilities are expected. There are many conservation, demand-side management and renewable energy projects and activities that Nebraska electric utilities are conducting or in which they are otherwise engaged. (See sections 4.4.4 and 4.4.5 for further information.) The current best estimate of Demand Side Management (DSM) activities in Nebraska is approximately 326 MW of summer peak load reduction (end use customer level).15 The 1996 IRP Coordination Report shows the statewide surplus of available capacity over firm obligations dropping below 400 MW in 1998. Without existing DSM Programs, the 1998 surplus would likely be a deficit, considering both the losses and the reserve requirements that would result if DSM resources were not utilized. Nebraska’s statewide forecast, which includes the DSM effects and supply side resource capability changes, is illustrated in Graph C4-4. The graph shows how loads and capability change and in which year deficits for the state could occur. This graph represents combined load and capability; every individual utility could have a different deficit year than those demonstrated. Graph C4-4 portrays three Cooper Nuclear Station scenarios. The first shows Cooper continuing to operate through its operating license of January 2014 and contract sales to MidAmerican ending in 2004 and is labeled "Original Capability" because this scenario was the basis for the original load and capability tables filed with the Nebraska PRB. In this scenario, the capacity for Cooper is utilized by NPPD after the contracts expire and the statewide deficit occurs in 2010. A second scenario, "Alt. 1 Capability," shows a situation in which Cooper Nuclear Station is retired after the MidAmerican contract expires, In this second scenario, the statewide deficit occurs in 2005. A third "Alt. 2 Capability" scenario shows conditions in which contracts continue through the operating permit of Cooper which ends January 18, 2014. In this third scenario, the statewide deficit year is 2008. Decisions regarding Cooper have not been made by NPPD, or power purchasers LES and MidAmerican.16 CHART C4-4
4.4 ENVIRONMENTAL ISSUES Environmental issues offer both indirect and direct financial impacts on utility operations and planning. With the bulk of the state’s power supply fueled by coal, clean air issues have a special significance. Other closely followed issues include low-level nuclear waste, hydro relicensing and rising interest in wind generation and other forms of renewable energy. 4.4.1 Clean Air The Clean Air Act (CAA), along with any forthcoming requirements, will continue to affect current as well as future electric generation in Nebraska.17 Nebraska generation currently operates at or near capacity levels. Any new generation in Nebraska is not expected to significantly increase existing emissions because new facilities will be required to operate under much tighter emission limits than existing units. The National Ambient Air Quality Standards (NAAQS) set the minimum acceptable air quality concentrations for six principal pollutants: carbon monoxide, lead, nitrogen dioxide, ozone, particulate matter (PM-10) and sulfur dioxide. These standards are health-based and require that states develop and implement plans to achieve attainment over a period of years. They can result in requirements for utilities and other industries to adopt the best available control technology for a pollutant irrespective of cost. The CAA requires that these standards be reviewed every five years to assure that the most recent data and techniques are used. Emission requirements are implemented through air permits. Based upon ambient air quality monitoring data areas are designated as either "attainment" or "nonattainment" depending upon whether they met the primary NAAQS over a three-year period. Nonattainment areas are typically found in densely populated urban areas. Under current standards, Nebraska measures up relatively well in meeting acceptable concentrations for the six principal pollutants. Lead Nitrogen Oxides Ozone Nebraska argued that it should not be part of the OTAG process based on the following: state generated emissions of NOx are less than 1 percent of the total emissions of the OTAG states; Nebraska is far removed geographically from any nonattainment area; and the upper level wind direction throughout the ozone producing season (summer) is not conducive to the transport of ozone or its precursors from Nebraska to nonattainment areas. There were 28 states out of the 37-state OTAG region which had higher state NOx emission totals in the OTAG database. For volatile organic compounds (VOC) emissions, there were 29 states out of the 37-state OTAG Region which had higher total emissions. Based upon these facts, the NPA passed a motion expressing their concerns that expensive emission control requirements might be imposed that would be neither warranted nor cost-effective. OTAG's final recommendation to the EPA was that Nebraska, along with 21 other states and portions of states, need not install OTAG-related control, but rather periodically review its emissions and the impact of increases on downwind nonattainment areas. As appropriate, steps such as control measures are to be taken to reduce such impacts. The EPA adopted this recommendation. Sulphur Dioxide Most Nebraska utilities project that they will have an adequate supply of allowances to cover SO2 emissions through the year 2010. This supply of allowances will include original allocated allowances, banked allowances which can be carried forward for use in subsequent years. Before 2010, many utilities in the state will begin to evaluate the need to purchase additional allowances or perhaps pursue other emission reduction strategies. In 1995, Nebraska utilities emitted 65,254 tons of SO2 which was 0.55 percent of the national total attributed to utilities. Out of the 48 contiguous states, 32 states had greater SO2 emissions in 1995, including Minnesota, Colorado, Wyoming, Kansas, Iowa, Wisconsin, North Dakota and Missouri.21 Hazardous Air Pollutants Carbon Dioxide (*This information does not imply an endorsement of any given position.) Currently there are no economical technologies available to reduce CO2 from the combustion of fossil fuel at power plants. The current and future cost of air emissions could put a premium on power sources such as hydro, wind, solar and nuclear, which do not emit carbon dioxide. However, many obstacles exist to utilization of these technologies. In 1995, the voluntary Climate Challenge Program noted 108 reports (96 from electric utilities) including NPPD, OPPD and the City of Wayne. In 1995, utilities in Nebraska emitted 20,325,120 tons of CO2, which was .90 percent of the national total attributed to utilities; 32 states out of the 48 contiguous states had higher CO2 emissions, including Colorado, Kansas, North Dakota, Iowa, Wisconsin, Wyoming and Missouri.26 Particulate Matter 4.4.2 Radioactive Waste The Low-Level Radioactive Waste Policy Amendment Act of 1985 (the 1985 Act) requires each state to be responsible for providing for the availability of capacity for the disposal of low-level radioactive wastes generated within its borders. The 1985 Act encourages states to enter into interstate compacts. Pursuant to the 1985 Act, Nebraska has entered into the Central Interstate Low-Level Radioactive Waste Compact with the states of Arkansas, Kansas, Louisiana and Oklahoma. The Compact chose Nebraska as the host state with Boyd County selected as the regional disposal facility location. The developer estimates that the pre-operational cost of the facility will be approximately $154 million. The state has issued draft reports and a public process is proceeding. A final decision is not expected before the end of 1999. The Nuclear Waste Policy Act of 1982 provides the framework for the disposal of spent nuclear fuel and high-level radioactive waste generated by electric utilities. The act requires that the DOE establish fees to cover all costs associated with the program and that DOE accept title, transportation and disposal of the fuel. NPPD and OPPD together have paid approximately $150 million in fees. DOE has indicated it will not be able to meet its 1998 statutory and contractual obligation to begin disposing of spent nuclear fuel. The DOE is currently evaluating the suitability of a site at Yucca Mountain, Nevada. The utilities’ contracts require the Federal Government to begin to accept high level nuclear waste by January 31, 1998. Thirty-seven (37) states and regulatory commissions, including Nebraska, and 25 utilities filed suit against DOE in June 1994 to gain clarification on the issue of spent fuel acceptance. Nebraska utilities currently have sufficient on-site storage for spent fuel at Cooper Nuclear Station and Ft. Calhoun Nuclear Station until 2004 and 2007, respectively. 4.4.3 Hydro Relicensing Approximately 18 percent of the state’s generating and purchase rapacity and 13 percent of energy generated and purchased in 1995 came from renewable hydro resources. Currently, three Nebraska power districts operate hydropower projects licensed by the Federal Energy Regulatory Commission (FERC), the agency responsible for licensing non-federal hydropower projects. Loup River Public Power District’s project on the Loup Canal with hydro plants at Columbus and Monroe was relicensed in 1984 for a period of 30 years. The Central Nebraska Public Power & Irrigation District (Central) and Nebraska Public Power District (NPPD) are currently in the 13th year of obtaining new long-term licenses from FERC for their projects. The projects are located along the North and South Platte Rivers and Platte Rivers in west central Nebraska. The relicensing/licensing requirements for hydro projects have changed substantially since the projects were originally licensed. Modifications to the Federal Power Act and other significant requirements - the Endangered Species Act (ESA), the National Environmental Policy Act, the Fish & Wildlife Coordination Act, the Clean Water Act, the National Historic Preservation Act and the Electric Consumers Protection Act (ECPA) - have added significant requirements to a FERC license. ECPA, in particular, instructs FERC to give equal consideration to the hydropower and non-hydropower benefits of a project. The ESA prohibits federal agencies from taking any action (including granting of a federal license) that would further harm a threatened or endangered species and their designated critical habitats. Recently, a Cooperative Agreement has been signed by the states of Nebraska, Colorado and Wyoming and the U.S. Department of Interior on a recovery program for endangered species in the Platte River Basin. This agreement and a subsequent program will address concerns related to wildlife and habitat for all projects in the Platte River Basin. FERC also must address fish and wildlife recommendations related to non-endangered species made by the USFWS and Nebraska Game & Parks Commission (NGPC) before issuing a final Environmental Impact Statement (FEIS). Following issuance of the FEIS, FERC can issue new licenses to Central and NPPD. There is not a firm schedule for completing this process. However, FERC will likely complete relicensing in mid-1998; although, the process may take longer, FERC has indicated the new licenses would be for a term of 40 years. Upon license issuance, Central and NPPD must decide if they will accept the new licenses and operate the projects with the conditions included in the licenses. Other parties to the licensing process must also decide whether or not the licenses should be contested. (Note: Central and NPPD were issued new FERC licenses in 1998.) 4.4.4 Conservation and Demand Side Management Programs Nebraska electric utilities have been involved in a range energy conservation projects that increase efficiency of electric utility operations, These are known as Demand-Side Management (DSM) programs that target energy savings through direct control measures, technological improvements or revisions in billing practices. DSM programs in the state generally fall into three major load shaping categories: load shifting, peak clipping and strategic conservation. Irrigation load control is categorized as load shifting and accounts for the greatest majority of demand reductions. (A small amount of ice storage cooling is also included as load shifting). Direct control of irrigation wells accounts for 66 percent of demand reductions. Time-of-use irrigation rates accounts for 1 percent. Peak clipping programs include interruptible customers (12 percent of demand reductions), air conditioner load control (7 percent), water heater controls (4 percent) and other methods (6 percent), such as dual fuel, municipal water pumping, automated energy management and curtailable loads. As part of these customer-oriented strategic conservation options, Nebraska utilities offer energy audits, provide information on energy conservation and promote technologies such as electric heat pumps that help balance seasonal peaks in electric loads. Conservation via high-efficiency air conditioners and heat pumps accounts for 4 percent of demand reductions. As previously noted, the current best estimate of DSM activities in Nebraska is approximately 326 MW of peak load reduction (end use customer level). Economic activity is also produced by these energy savings. As DSM programs have assumed an increasingly important role in providing economically priced electricity to Nebraska customers during the last several years, Nebraskans have invested more than $16,000,000 in equipment necessary to employ peak clipping and load shifting DSM strategies.28 Generally, Nebraska utilities have aggressively pursued strategies that help reduce daily and seasonal peaks (Demand-Side Management) where economic return is the highest, but have not been as aggressive in providing consumer conservation programs as an alternative to generation due to the relatively lower direct economic return. Of the various customer-oriented conservation programs, Nebraska’s utilities have reported the following:29
Source: LR 455 Survey 4.4.5 Renewable Energy In the renewable energy field, contributions to Nebraska energy production from non-hydro renewable resources have been minimal to date. As noted in chart C4-1 and C4-2 approximately 18 percent of the state’s demonstrated capacity and 13 percent of its energy generated is hydroelectric. Interest in non-hydro renewables has been rising as noted by several bills submitted to the legislature concerning biomass and wind power, as well as "green pricing."30 The non-hydro renewable energy generation option receiving the most attention at this time is wind energy generation. A joint Nebraska wind project of 1.5 MW is planned for 1998 as part of an Electric Power Research Institute (EPRI) project and the Nebraska Power Association is involved in monitoring wind speed and solar data at eight sites across the state. The monitoring project is being undertaken with the Nebraska Energy Office, the Nebraska Industrial Competitiveness Service, Nebraska Citizen Action and the Union of Concerned Scientists. NPPD and KBR Rural Public Power District are monitoring wind speed at an additional site as well. Several utilities are also involved with installing solar powered stock watering systems. In addition to this interest and activity, there are four recorded customer-owned renewable generation plants in Nebraska: two methane-fueled plants in OPPD’s service area, one methane-fueled plant in Lincoln and one wind generator in LES’s service area.31 The four plants total 4.05 MW of renewable generating capacity. This represents about 0.1 percent of the total installed generating capacity of the Nebraska utilities. In comparison, national averages indicate renewable resources (excluding hydro) represent approximately 2 percent of all (utility and non-utility) generating capacity in the United States.32 4.5 TECHNOLOGY DEVELOPMENT The ability to generate and deliver electricity in a cost-effective, reliable manner by taking advantage of advances in technology is critical to maintaining competitive rates, quality of service, customer satisfaction and environmental compliance. The primary vehicle which electric utilities in the United States and in Nebraska use to conduct research and development of new technology is the Electric Power Research Institute (EPRI). Created in 1973 by the nation’s electric utilities, EPRI is one of America’s oldest and largest research consortia with about 700 utility members. By pooling resources, a wider spectrum of projects are possible than if each utility was funding research efforts individually. Total EPRI funding for research, development and delivery in 1996 was $240.9 million. Nebraska electric utility members paid a total of $3,461,368 in 1995 dues. These utilities also have staff members (35) who serve on various EPRI business unit advisory and governing boards. In addition, they also contributed $607,410 for state and local research and $336,756 for other national research in 1995. Research and development activities by EPRI included many projects. A few examples include renewable energy, superconductivity, electric and magnetic field effects, clean coal gasification, fuel cell and acid rain. Nebraska utilities are involved in utilization or active investigation of potential use or feasibility of use of many technologies, such as renewable generation, power quality, advanced metering, high efficiency HVAC and ground source heat pumps. 4.6 WORK FORCE The utility work force is the backbone of day-to-day operations and management. Nebraska electric utilities reported approximately 6,700 full and part-time employees for 1995. By employment sector, approximately 36 percent worked in the generation/production function, 46 percent in the transmission and distribution function and 18 percent in administrative functions.33 The Nebraska electric utility industry employs a wide spectrum and diverse mixture of employment classifications. Employment job classifications are generally categorized as skilled craft (power plant operators, fine technicians, electricians, etc.), professional (engineers, accountants, managers, etc.), and administrative/office support (secretaries, clerks, account specialists, etc.) The total payroll (1995) of the 49 reporting utilities exceeded $269 million. There are more than 2,000 employees in 11 utilities represented under a collective bargaining agreement. Most Nebraska utility employees work under safety policies and procedures which substantially mirror the OSHA regulations, but of the Nebraska systems, only rural cooperatives are required to operate under Federal OSHA requirements. Nebraska electric utilities are subject to the State Department of Labor regulations on written injury prevention programs.34 Responding Nebraska utilities showed favorable OSHA Incident Rates compared to national statistics compiled by the Bureau of Labor Statistics
Source: Bureau of Labor Statistics, 1995; LR 455 Survey There has been a national trend toward downsizing of work force among private investor-owned utilities and large public power systems preparing for the pressures of competition. An emerging issue for the Nebraska work force will be the potential impact deregulation and competition might have on work force size, levels of safety and service quality. To reinforce the utility labor available during periods of emergency, the Nebraska Power Association has established a mutual aid agreement between municipal, public power district and rural cooperative systems under which impacted utilities can request assistance during natural disasters. Supplementing that agreement are independent contracts with arborists for line clearance, contracts with private electricians and contracts with line technicians. 4.7 SYSTEM EFFICIENCY The general measure of efficiency and effectiveness of the Nebraska systems is evident in the state’s average retail electric rate. As noted in Chapter 2, Nebraska’s average rate in 1995, 5.4 cents/kwh, was the 11th lowest in the nation (tied with Wisconsin). This compares to a U.S. average rate of 6.9 cents/kwh. The primary factors contributing to this low rate include the state’s relatively low cost of power produced by coal and hydro plants, as well as power purchases from WAPA. Also contributing to the state’s 5.4 cent/kwh average rate is a range of operational factors. Nebraska electric systems report engaging in many system efficiency improvements to enhance their quality and cost performance. Among these efforts are: use of optimum staffing and re-engineering, employing least cost planning strategies (life cycle costs), cost-effective out-sourcing of services, shared services, purchasing low-loss electrical equipment, optimizing equipment loading, enhanced utilization of technology to improve reliability and performance, enhanced computer based applications, implementation of generation station heat rate improvement programs, life extension and capacity augmentation of electric facilities and advanced preventive maintenance efforts.35 On both a regional and national comparative basis, Nebraska electric utilities indicate favorable operating, planning and rate statistical measures. Statistics gathered on key financial and operating ratios for Nebraska compared to regional and national averages, are shown in a series of charts below. The Nebraska statistics are divided into two components, i.e., Rural Systems and "All Other" systems. COMPARATIVE OPERATIONAL DATA CHARTS MN = MEAN or Average; MD = Median or Midpoint A. Distribution O&M per Customer
Description: This ratio measures the average distribution expense associated with delivering power and energy to each retail customer. Distribution costs include labor, supervision, engineering, materials and supplies used to operate and maintain the distribution system. Customer density, ovehead versus underground facilities and level of storm-related expenses can all impact this measure. O&M expenses do impact reliability. B. Distribution O&M per Mile (pole/circuit)
Description: This ratio is similar to the above except the per unit is pole/circuit mile of line. The ratio is impacted by customer density, type of distribution construction and level of storm-related expenses, among others. The significantly lower rural figure is due to the fewer number of customers per mile of line and the greater number of line miles. C. Total O&M (minus power supply) per Customer
Description: This ratio measures on a per customer basis all O&M expenditures (except power supply - production and purchased power). It would include transmission, distribution, customer accounting, customer service and sales plus administrative general expenses. The level of transmission facilities and customer density both impact this ratio, among others. D. Retail Customers Served per Non-Generation Employee
Description: This ratio calculates the average number of retail customers served per non-generation employee. Generation employees are deleted to take into consideration not all utilities produce power, i.e., some purchase their requirements and would have no generation employees. E. Administrative and General Expense per Retail Customer
Description: A&G expenses are those not allocable to the cost of power, transmission, distribution, accounting and customer service. They might include certain administrative salaries, property and liability insurance, professional fees and expenses not otherwise provided for elsewhere. It is measured in terms of the average per retail customer served. F. Debt Service Coverage (times covered)
Description: The ratio of net revenues available for debt service to total long-term debt service for the year. The ratio measures the ability to meet its current long-term obligations. NOTE: Nebraska rural statistics derived from CFC report for 24 Nebraska rural systems instead of NPA survey data. G. Annual Load Factor
Description: Ratio of system average demand to system peak demand. Discussion on Comparative Operational Data Charts The seven comparative statistical ratios are defined in two segments: for "Rural" Nebraska electric system and "All Other" Nebraska system. The division is to reflect the differences in system characteristics plus comparative rural utility data is available from NRUCFC on a regional and limited national basis. The "All Other" Nebraska category is compared to APPA or investor-owned data where available. While the description following each measure is fairly self-explanatory, some additional commentary is warranted. A&B. Distribution O&M Per Customer and Distribution O&M Per Mile: The low customer density in Nebraska is a factor in deviations from the comparative statistics both nationally/regionally. When measured on per mile of line basis, the Nebraska statistics look more favorable. There is a direct relationship between O&M expenses and reliability so performing minimal distribution O&M is not prudent. C. Total O&M (minus power supply) Per Customer: With power supply costs excluded, all other O&M expenses per retail customer is a useful measure. For all utilities, these would be the costs for the power delivery "wires" business plus support functions, including A&G, customer billing, etc. Nebraska comparative statistics are favorable. D. Retail Customers Served Per Non-Generation Employee: If generation employees are deleted to eliminate the difference between the purchase power utility from the generation utility, this measure is indicative of the number of retail customers served per employee. Nebraska statistics are below the national/regional averages. Customer density is a factor. If utilities haw a relatively low customer count, but many miles of facilities have to be maintained, this ratio would be negatively impacted. A transmission utility would require may employees to maintain transmission facilities E. Administrative and General Expenses Per Retail Customer: Nebraska statistics for these expenses appear very favorable. F. Debt Service Coverage: Generally the Nebraska rural utilities have less debt than their regional counterparts, while the Nebraska "Other Utilities" have a greater debt to total assets ratio. Because the majority of the debt incurred is due to power plant/generation construction, this is to be expected, i.e., NPPD, OPPD, MEAN, LES. In term of debt service coverage, the Nebraska rural system are in line with regional rurals while the "All Other" Nebraska utilities is less than regional/national ratios. The primary reason is the debt incurred for power plant construction. A typical APPA utility would purchase and not finance generating plants to produce power. G. Annual Load Factor: Nebraska utilities are below both regional and national statistics. High summer loads due to air conditioning, relative to the average annual use of electricity, contribute to this result. Also the statewide demographics of lower than national industrial sales (which tend to exhibit more levelized annual consumption) is also a factor. Demand side management including irrigation load control and off-peak load building program help improve this ratio. 4.8 SUMMARY AND EMERGING ISSUES Competitive pressures could have extensive effects on electric facilities, operations and planning for Nebraska systems. The following questions address a range of potential impacts: In a competitive retail market system what operational options would there be for generation, transmission, or distribution? What would the impact of any given option be on electric facilities within the state?
What would the impacts of any given option be on joint planning to assure efficient operations and delivery of service?
What would the impacts of any given option be on the work force, safety and quality of service? What would the overall impact of any given option be on effectiveness of service delivery and cost to customers? Chapter Two - STRUCTURE AND GOVERNANCE Chapter Three - STATUTORY AND REGULATORY OVERSIGHT Chapter Four - PLANNING AND OPERATIONS Chapter Five - FINANCE AND TAX Chapter Six - DEREGULATION AND RESTRUCTURING The Central Nebraska Public Power and
Irrigation District
|
|||||||||||||||||||||||||||||||||||||||||||||||||||||||||||||||||||||||||||||||||||||||||||||||||||||||||||||||||||||||||||||||||||||||||||||||||||||||||||||||||||||||||||||||||||||||||||||||||||||||||||||||||||||||||||||||||||||||||||||||||||||||||||||||||||||||||||||||||||||||||||||||||||||||||||||||||||||||||||||||||||||||||||||||||||||||||||||||||||||||||||||||||||||||||||||||||||||||||||||||||||||||||||||||||||||||||||||||||||||||||||||||||||||||||||||||||||||||||||||||||||||||||||||||||||||||||||
